 Research Activities
|
|||||||||||||||||||||||||||||||||
1. Integrated superconducting receivers and spectrometers The main objective of this work is to develop and test a family of Superconducting Integrated Receivers (SIR) with quantum-limited sensitivity and high-resolution spectrometers for submm wave frequencies (up to 700 GHz). This family includes a prototype of an airborne integrated spectrometer with a noise temperature close to the quantum limit hf/k, intended for monitoring ozone, chlorine compounds and industrial contaminants in the atmosphere. The desired parameters of this instrument are as follows: frequency range 500-650 GHz, noise temperature (DSB) below 250 K, spectral resolution better than 1 MHz. An important application of this spectrometer will be as an instrument for a heterodyne balloon mission launched to study the Earth atmospheric chemistry and physics in the Terahertz LImb-Sounding mode (TELIS). The TELIS project is a pre-cursor for future satellite space missions. This spectrometer is under development in collaboration with National Institute for Space Research of the Netherlands (SRON). During last few years the microcircuits of the integrated spectrometer for atmosphere monitoring comprising phase-locked superconducting local oscillator based on flux flow oscillator (FFO) has been designed, fabricated and successfully tested. The main technology challenge is to combine the quantum-limited sensitivity of a SIS mixer with the high spectral resolution of a receiver using a phase-locked FFO as LO. According to proposed concept the power emitted by the FFO is distributed between two SIS mixers; the first SIS junction is employed as a traditional quasiparticle receiver element, incorporated in a double-dipole antenna for signal detection, while the second one is used as a harmonic mixer for down conversion and stabilization of the FFO frequency (see Fig. 1).
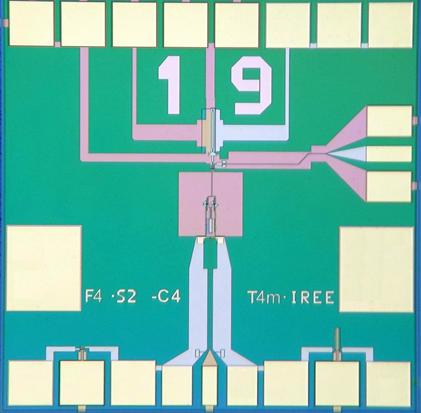
Fig. 1. Block-diagram showing the SIR concept with a phase-locked FFO for the TELIS project. As demonstrated by the project participants, a Josephson Flux Flow Oscillator (FFO) is the best-developed superconducting local oscillator for integration with an SIS mixer in a single-chip submm-wave receiver. Local oscillators based on Nb‑AlOx‑Nb and Nb-AlN-NbN FFO’s have been successfully tested from about 120 to 700 GHz (gap frequency of Nb). They appeared to provide enough power to pump an SIS-mixer (about 1 m W at 450 GHz); both the frequency and the power of the FFO can be DC-tuned. Detailed measurements of the FFO radiation linewidth were performed using an integrated harmonic SIS mixer in the frequency range 250-700 GHz; the FFO linewidth and spectral line profile were compared to theory. A Lorentzian shape of the FFO line has been observed both at high FFO bias voltages on the flux flow step (FFS) and at lower voltages in the resonant regime on the Fiske steps (FS’s). Experimentally, the dependence of the FFO linewidth on frequency is found; a possible explanation was proposed. An abrupt increase of the linewidth at a FFO frequency corresponding to 1/3 of the gap voltage was found; it is caused by Josephson self-coupling (JSC). For the Nb-AlOx-Nb FFOs the JSC takes place at 470 GHz, for the Nb-AlN-NbN FFOs at 620 GHz, correspondingly).The SIR microcircuits were fabricated on a Si substrate using high quality Nb-AlOx-Nb or Nb-AlN-NbN tri-layer; photo of the SIR chip (size 4 x 4 x 0.5 mm) is presented in Fig. 2. To achieve the wide instantaneous bandwidth of 500-650 GHz, a side-feed twin-SIS mixer with 0.8 μm2 junctions was implemented. Fourier transform spectrometer (FTS) tests of these microcircuits demonstrated the possibility to obtain the required instantaneous bandwidth for the twin SIS mixer.The receiver chip is placed on the flat back surface of the Si lens, forming an integrated lens-antenna system (Fig. 3). One of the constraints implied by the SIR is the requirement to place the receiver chip inside a cylindrical magnetic shield as the FFO is very sensitive to external interferences. The magnetic shield consists of two coaxial cans. The external layer is made of cryo-perm, and the internal one is copper covered with 100 mm of superconducting lead. The SIR chip is positioned far enough from the opening of the shielding cans, which is the only aperture for entering the signal beam and all electrical connections. The magnetic shield is 90 mm long and has an inner clear aperture of 25 mm (see Fig. 3). Thus the integrated lens-antenna configuration should be compatible with large f-number optics. This is realized by using an elliptical lens and locating the feed antenna at the more distant focus of the ellipse. The lens diameter of 10 mm is selected by optimizing for the minimum beam size at 100 mm from the integrated lens-antenna at 500-650 GHz, so that the shielding cylinder does not truncate the beam. To minimize the reflection loss at the lens-air interface, the curved surface of the lens is coated with a 74 micron thick Stycast antireflection coating, optimized for the center frequency 600 GHz.
Fig. 2. Microphotograph of the integrated receiver microcircuit developed and fabricated at IREE.
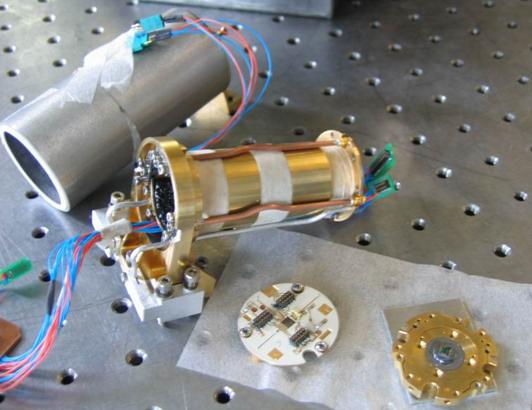
Fig. 3. Photo of the mixer block with shields for measurements of the integrated spectrometer. The measured double sideband (DSB) receiver noise temperature TR, uncorrected for any loss, is presented in Fig. 4 as a function of LO frequency, and in Fig. 5 as a function of IF frequency. As can be seen, the noise is well below 200 K at all frequencies of interest, with a minimum of 120 K at 500 and 600 GHz. The noise peak around 540-575 GHz is partially spurious, caused by absorption of water vapor in the path between calibration sources and the cryostat, and partially real due to properties of the SIS-mixer tuning circuitry. The relatively high noise in this band is of no concern for science observations, since this part of the atmospheric spectrum is obscured by a highly saturated water-vapor line rendering it virtually useless for atmospheric science. The noise as a function of IF is fairly flat in the frequency range 4-8 GHz, as can be seen in Fig. 5. The dependence of the receiver noise temperature on the SIS bias voltage is shown in Fig. 6 and one can see that for Nb-AlN/NbN circuits there is very wide range of SIS bias voltages where TR is almost constant.
Fig. 4. Measured DSB receiver noise temperature of the SIR device selected for flight at 8 GHz IF frequency (red line) and integrated in the 4-8 GHz IF range (blue curve). .
Fig. 5. Receiver noise temperature as a function of IF frequency, taken at two FFO frequencies: 497 and 601 GHz.
Fig. 6. Receiver noise temperature as a function of the SIS bias voltage measured at the FFO frequency 497 GHz. To ensure stable FFO phase locking, a reasonably good spectral ratio (SR) is needed. This ratio is defined as the ratio between the carrier and the total power emitted by the FFO. The SR value for the given PLL system is unambiguously related to the free running FFO linewidth and it was found that this linewidth has to be well below 10 MHz. It is noted that the SR can be estimated in-flight and therefore the exact FFO line shape can be reconstructed which is of relevance for the data analysis. The measured free-running linewidth in the frequency band 350 – 750 GHz ranges from 0.5 to 7 MHz allowing to phase-lock 95% to 35 % of the emitted FFO power. An example of the free-running (frequency-locked) and phase-locked spectrum of the FFO measured for the flight SIR at 515.25 GHz (one of the selected flight-frequencies) is presented in Fig. 7.
Fig. 7. Spectra of the FFO operating at 515.2 GHz (blue curve – frequency locked; red curve – phase-locked). Linewidth (LW) = 1.5 MHz; Signal to Noise Ratio (SNR) = 36 dB; Spectral Ratio (SR) = 93.5 %. Spectra measured with RBW = 1 MHz, span = 100 MHz. Data for five selected flight frequencies are summarized in Table 1. To investigate the frequency resolution of the receiver, the signal of a solid-state multiplier driven by a synthesizer, was coupled in. The output signal recorded by a spectrum analyzer with 30 kHz resolution bandwidth is the convolution of the delta-like function of the synthesizer with the phase-locked signal of the FFO; this measurement indicates a frequency resolution of the SIR receiver better than 100 kHz. Table 1 Data for the flight SIR at selected TELIS frequencies
The SIR is a complicated device as it contains multiple interactive superconducting elements: a SIS mixer, an FFO, and an HM for the FFO phase locking. Special algorithms and procedures have been developed and tested to facilitate characterization of the SIR at reasonable time scales and for the SIR control during the flight. These routines include:
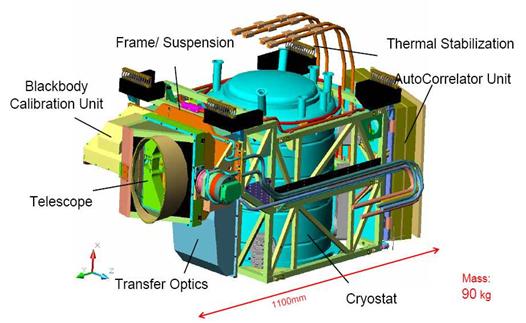
For the measurement strategy it is important to know the stability of the complete receiver chain. The stability determines the maximal achievable measurement time and thus the required frequency of the calibration cycle. The stability of the complete TELIS-SIR system has been determined with a noise-fluctuation bandwidth of 17 MHz. For the two IF channels that are used to determine the Allan variance it is found that the Allan stability time is about 13.5 seconds. When the difference of the two channels is taken to determine the Allan variance (this is the so-called spectroscopic, or differential, mode), an Allan stability time of 20 seconds is found. Implementation of the integrated receiver for Earth atmosphere monitoring. TELIS (TErahertz and submillimeter LImb Sounder) is a three-channel balloon-borne heterodyne spectrometer for atmospheric research developed in a collaboration of three institutes: Deutsches Zentrum für Luft- und Raumfahrt (DLR), Germany, Rutherford Appleton Laboratories (RAL), United Kingdom, and SRON – Netherlands Institute for Space Research, the Netherlands. The three receivers utilize state-of-the-art superconducting heterodyne technology and operate at 500 GHz (by RAL), at 480 – 650 GHz (by SRON in tight collaboration with Kotel’nikov Institute of Radio Engineering and Electronics, IREE, Moscow), and at 1.8 THz (by DLR). TELIS is designed to be a compact, lightweight instrument capable of providing broad spectral coverage, high spectral resolution and long flight duration. The TELIS instrument serves also as a test bed for many novel cryogenic technologies and as a pathfinder for satellite based instrumentation. The TELIS instrument (see Fig. 8) is mounted on the same balloon platform as the Fourier transform spectrometer MIPAS-B, developed by IMK (Institute of Meteorology and Climate research of the University of Karlsruhe, Germany), and both instruments observe simultaneously the same air mass. Together, they yield an extensive set of stratospheric constituents that can be used for detailed analysis of atmospheric chemical models, such as ozone destruction cycles. In particular, the 480 – 650 GHz TELIS channel is able to measure vertical profiles of ClO, BrO, O3 and its rare isotopologues, O2, HCl, HOCl, H2O and 3 rare isotopologues, HO2, NO, N2O, NO2, HNO3, CH3Cl, and HCN.
Fig. 8. Design drawing of the complete TELIS instrument. The SIR channel is controlled with a battery-operated ultra low-noise biasing system. Since noise on the bias lines of the FFO translates in a wider FFO linewidth, several precautions, like decoupling of digital control lines and extensive filtering and shielding, are implemented. The SIR bias unit is digitally controlled by the on-board DLR PC-104 computer, that also interfaces with the other channels, the digital autocorrelator, and with the host instrument MIPAS. A radio link provides real-time two-way contact with the ground segment consisting of a server computer with three dedicated client computers, coupled through TCP/IP socket connections. The complete system is dimensioned to have sufficient cooling liquids and battery power for a 24 hour flight. The TELIS-SIR channel has been characterized in eight micro-windows that have been selected for the flight in Kiruna. These micro-windows have the following LO frequencies:
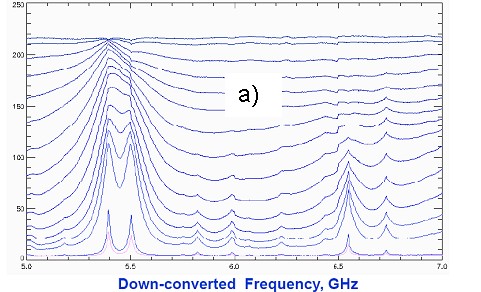
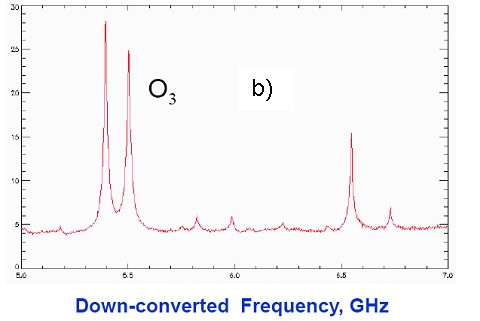
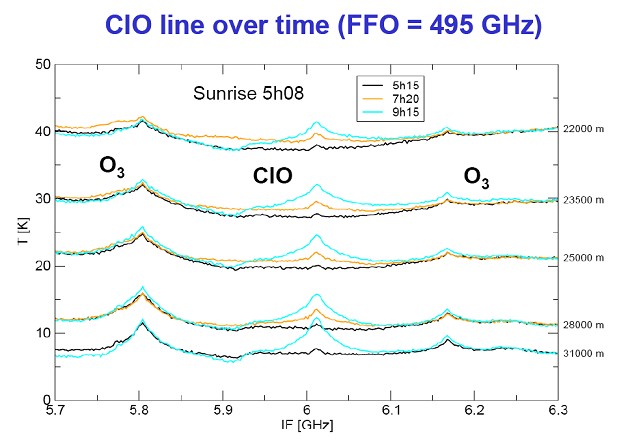
519.25 GHz for BrO and NO2 607.70 GHz for ozone isotopes 619.10 GHz for HCl, ClO and HOCl. Initial flight values for the parameters for the FFO, SIS and HM mixers have been determined for each micro-window. Dedicated algorithms allowing for fast switching between LO frequencies and for in-flight optimization of the SIR, have been developed. It takes about 1 minute of stabilization and optimization to switch between two LO settings. TELIS had its first successful scientific campaign from Kiruna, North-Sweden. The instrument was launched together with the MIPAS instrument on the MIPAS-B2 gondola at 0h18, local time, on 11 March 2009 (see Fig. 9). During ascent the SIR channel behaved nominally and already after 30 minutes the first spectra were recorded. After 3 hours the first flight ceiling was reached around 35 km. Several night recordings were taken, necessary for background measurements for species with a diurnal cycle and for instrument calibration. The instrument proved to be stable against the strong temperature variations of the atmosphere during ascent (with ambient temperatures as low as minus 70°C) and during sun-rise. Due to strong western winds the balloon was lowered to approximately 30 km. The wind direction changed to south east, resulting in a long flight over Finland. During the whole morning the diurnal cycle of various species was monitored until the very end of the flight at 11h30. In total several hundred limb sequences have been recorded. The MIPAS-TELIS balloon system performed nominally during the flight. Spectra presented in Fig. 10 confirm high resolution and very good sensitivity of the TELIS device. Fig. 11 shows increase of the ClO concentration on different attitudes after sun rise. After parachute landing and recovery the instruments were found to be undamaged, allowing for extra post-flight calibration measurements.
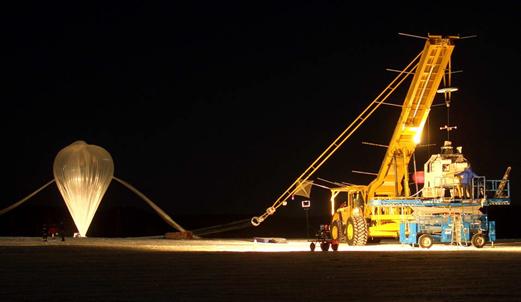
Fig. 9. Gondola of the MIPAS-B Fourier-spectrometer with TELIS instrument in board just before launch at Esrange Space Center, Sweden. Balloon size: 400 000 m3; payload weight: 1 200 kg.
Fig. 11. Spectra measured during the flight in March 2009,
which demonstrate increase of the ClO concentration after sun rise. Measurements
were performed for different limb scanning directions (from top to bottom curves
for 22, 23.5, 25, 28 and 31 km are presented). |
|||||||||||||||||||||||||||||||||
|
Home | Staff | Activities | Publications | Collaboration | VirtualVisit | Links | |