|
|
|
|
|
|
|
|
|
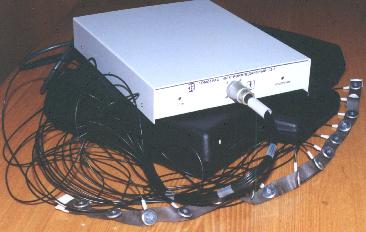
The measuring unit of the electrical impedance tomograph. |
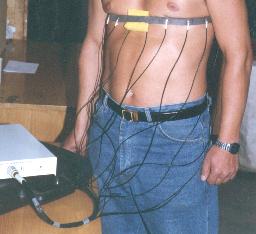
The belt with electrodes for measurements on thorax |
|
Right |
|
|
Anterior |
The animation represents one respiratory cycle, the cardiac pulsations are visible also. The static visualization is demonstrated: 1 - spinal column, 2 and 3 - right and left lungs, 4 - heart. The brightest colors correspond to highest conductivity
|
|
||
|
|
|
|